

The four bars on your smartphone screen are a marketing abstraction rather than a technical measurement of network performance. In the Australian landscape, where the distinction between a good and basic signal is now defined by strict ACMA standards, relying on these icons often leads to frustration during critical dropouts. If you've ever wondered why your device shows full reception yet fails to load a simple webpage, you need to learn how to measure mobile signal strength using decibel-milliwatts (dBm). This guide explains how to bypass unreliable visual indicators to obtain the precise data required for a stable connection.
We understand the frustration of inconsistent 5G performance and rural connectivity gaps that the new standardised 2026 coverage maps don't always fully resolve. This article will provide you with the technical framework to quantify your cellular environment, moving from guesswork to professional-grade metrics. You'll learn the specific differences between signal strength and signal quality, how to access hidden field test menus on modern devices, and why specific hardware like LMR-400 cabling is essential for preserving the integrity of your measurements.
Key Takeaways
- Shift your focus from subjective signal bars to objective decibel-milliwatts (dBm) to gain a precise, clinical understanding of your network's actual performance.
- Learn how to measure mobile signal strength by accessing hidden Field Test Mode menus and specialised diagnostic apps to view raw metrics like RSRP and SINR.
- Execute a methodical walk-test during your site audit to identify the specific environmental factors and physical obstructions that create indoor reception dead zones.
- Use your collected data to determine whether your installation requires a Cel-Fi GO booster for voice coverage or high-gain MIMO antennas for improved data throughput.
- Ensure your hardware deployment maintains signal integrity by utilising low-loss LMR-400 coaxial cabling to minimise attenuation between your antenna and the booster.
Beyond the Bars: Why Mobile Signal Strength is More Than a Visual Icon
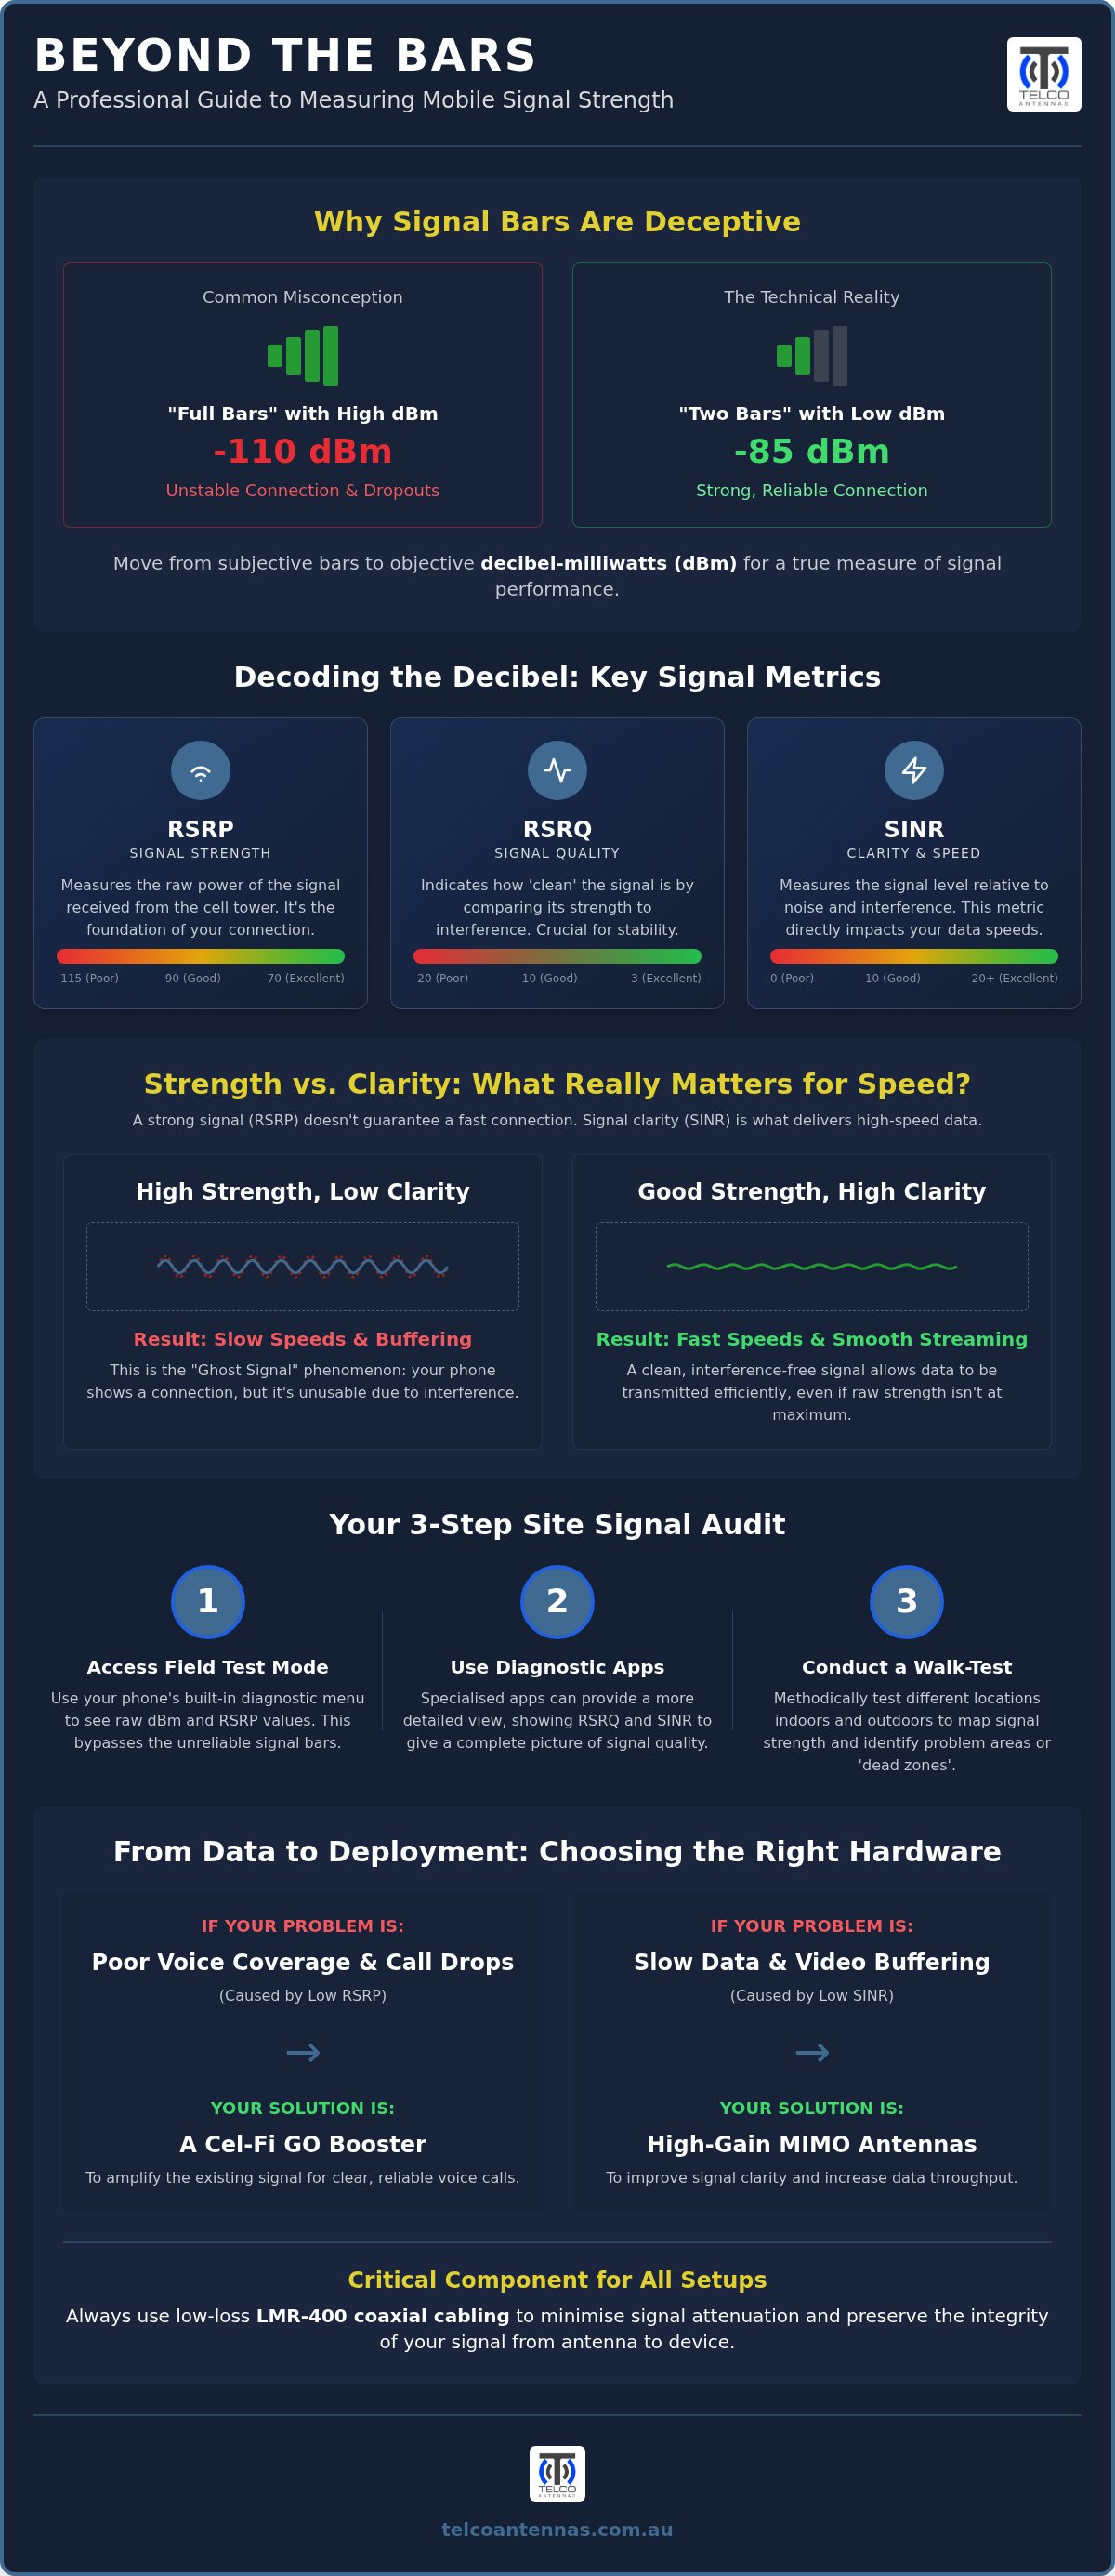
The signal bars on your handset are a subjective interpretation of network availability, not a precise engineering value. Because there is no industry-wide standard for what "three bars" represents, manufacturers like Apple and Samsung use proprietary algorithms to translate complex radio frequency data into a simple icon. This lack of uniformity is the primary reason why two different devices standing in the same spot on the same network often display conflicting reception levels. To truly understand how to measure mobile signal strength, you must look past these icons and investigate the raw power levels the device is actually receiving.
The Problem with Handset Standardisation
Handset brands prioritise user experience over technical transparency. One manufacturer might set the threshold for "full bars" at -85 dBm, while another might be more conservative, requiring -75 dBm to show the same graphic. Beyond software, the physical architecture of the phone plays a critical role. The placement and efficiency of internal MIMO antennas determine how effectively a handset can capture a signal in challenging environments. This variation means that visual indicators are fundamentally flawed for any professional site audit or hardware planning.
Introduction to dBm: The Engineer's Metric
Decibel-milliwatts (dBm) provide an absolute power ratio that remains constant across all hardware. Unlike bars, which are arbitrary, dBm is a logarithmic unit that measures the power level relative to one milliwatt. In modern 4G and 5G networks, engineers specifically track Reference Signal Received Power (RSRP) to determine the strength of the carrier signal. When learning how to measure mobile signal strength, you'll find that dBm provides a clinical accuracy that visual icons cannot match. This metric is the only reliable constant for signal auditing because it removes manufacturer bias from the equation.
The dBm scale typically ranges from -50 dBm, which indicates an exceptionally strong signal, down to -115 dBm, the threshold the ACMA defines as "no coverage" for official maps. It's vital to understand the logarithmic nature of this scale; a 3 dB increase actually represents a doubling of the signal power. Conversely, the "Ghost Signal" phenomenon occurs when you have high RSRP (strength) but poor signal quality. This usually stems from interference or tower congestion, proving that raw strength is only half of the connectivity puzzle in the Australian environment.
Decoding the Decibel: Understanding RSRP, RSRQ, and SINR Metrics
Strength alone is a deceptive metric for modern connectivity. When you investigate how to measure mobile signal strength, you must distinguish between the raw power reaching your device and the quality of that data stream. A device can report a high power level while failing to maintain a basic voice call if the signal is saturated with noise. Understanding the relationship between RSRP, RSRQ, and SINR is the only way to diagnose why a seemingly strong 5G connection is underperforming in a real-world environment.
RSRP (Reference Signal Received Power) measures the linear average of the power levels across the frequency bandwidth. While RSRP provides the foundational connection, RSRQ (Reference Signal Received Quality) identifies how much of that received signal is actually usable information. Measured on a scale typically between -3 dB and -20 dB, a reading closer to -3 dB indicates a clean signal. Anything below -15 dB suggests significant congestion or interference, which is why a device showing full bars can still experience packet loss and jitter.
RSRP vs. SINR: Which One Matters Most?
RSRP gets you the connection, but SINR (Signal-to-Interference-plus-Noise Ratio) gets you the speed. Learning how to measure mobile signal strength effectively requires a focus on SINR, as this value determines the signal's capacity to carry data without errors. In the Australian context, dense foliage or undulating terrain often causes signal scattering. This introduces noise even when you are relatively close to a cell tower. Pilot pollution is another common issue where your handset receives signals from multiple towers on the same frequency, causing them to compete and degrade the SINR. While performance is the goal, these measurements also confirm that even optimised installations operate safely under the ARPANSA Safety Standard for radiofrequency exposure.
Interpreting Your Readings
Interpreting these metrics requires a clinical approach. Because 5G relies on complex MIMO configurations to achieve high speeds, even a minor dip in signal quality can force the hardware to drop back to 4G standards. You can categorise your findings using the following engineering thresholds:
- Excellent: RSRP > -80 dBm, SINR > 20 dB. Ideal for high-speed 5G data and low-latency applications.
- Good/Fair: RSRP -80 to -95 dBm, SINR 10 to 20 dB. Reliable for most residential and commercial needs.
- Poor/Cell Edge: RSRP < -100 dBm, SINR < 10 dB. Expect frequent dropouts and significantly reduced throughput.
If your RSRQ fluctuates wildly, you're likely experiencing cell edge behaviour, where the device struggles to hand over between towers. If your DIY audit reveals these quality gaps, a professional RF site survey can identify the exact interference sources and the mechanical solutions required to stabilise your link.
Essential Tools for Professional Signal Measurement in Australia
The transition to 5G Standalone (SA) networks across Australia in 2026 has rendered many consumer-grade signal apps obsolete. To understand how to measure mobile signal strength accurately, you must utilise tools that interface directly with your device's modem or dedicated radio frequency (RF) hardware. While a smartphone is a capable starting point, commercial-grade installations often require the precision of a signal analyser to account for environmental variables that a standard handset might ignore. Using the right diagnostic interface ensures the data you collect is a true reflection of the RF environment.
Accessing Field Test Mode on Your Handset
Most Australian handsets contain a hidden diagnostic interface known as Field Test Mode. On an iPhone, you can access this by opening the dialler and entering *3001#12345#* followed by the call button. This launches a dashboard that bypasses the standard UI to show raw network data. For those using Android devices, the menu is often found by dialling *#*#4636#*#*, though this varies by manufacturer. Once inside, navigate to the 'Serving Cell Info' or 'NR Connection' tabs to find your RSRP and SINR values. It's best to keep this menu open while walking the perimeter of your property to identify how physical structures impact the signal in real time.
Network Mapping and Tower Location Tools
Raw data is only useful if you know the origin of the signal. Identifying your local Telstra, Optus, or TPG tower is a critical step in the auditing process. Resources like Oztowers or the official ACMA database allow you to locate the exact coordinates of nearby infrastructure. This is particularly important for 2026 5G deployments, as knowing the tower's bearing allows you to align directional antennas with precision. You should also identify the specific frequency band your device is using. For example, the B28 700MHz band is common for long-range rural coverage, whereas higher frequency 5G bands offer more speed but have significantly less penetration through building materials.
For complex environments or remote commercial sites, a smartphone's internal antenna may not provide enough detail to guarantee a stable link. In these instances, professional RF site surveys are necessary. These surveys use calibrated signal metres to detect interference and path loss that standard handsets cannot register. Using professional equipment ensures that when you invest in hardware, the deployment is based on clinical data rather than a momentary reading from a consumer app. If your DIY measurements show wild fluctuations, it's a clear indicator that an engineering-led audit is required to stabilise the connection.
Step-by-Step: How to Conduct a Site Signal Audit
Conducting a professional-grade audit requires a methodical approach to eliminate environmental variables that can skew your data. Before you begin investigating how to measure mobile signal strength, you must disable Wi-Fi and Bluetooth to ensure your handset modem is forced into a direct cellular handshake. If your device supports multiple SIMs, ensure you've selected the specific carrier network you intend to audit. This preparation prevents the device from switching to a secondary tower or a local network during the measurement process.
The 'Walk-Test' method is the industry standard for mapping internal coverage. You should take measurements at each of the four corners of the building and one in the centre. Hold the handset at least 30 centimetres away from your body to avoid 'body loss' attenuation, which can drop your reading by several decibels. Wait approximately 30 to 60 seconds at each point to allow the modem to update its RSRP and SINR metrics, as modern handsets don't always refresh these values instantaneously. Accuracy requires patience.
Measuring at the roofline is also essential for antenna planning. Height testing helps you determine if a roof-mounted antenna can clear local obstructions like dense foliage or neighbouring structures. If you find that the signal improves significantly at a height of 3 to 5 metres, it indicates that a high-gain antenna on a mounting pole is the most viable path forward for your installation.
Establishing an Outdoor Baseline
To determine the 'Building Penetration Loss', you must establish a best-case baseline. This involves taking a reading at the highest accessible point of the property, typically the roofline or a high-set balcony. By comparing this outdoor RSRP value to your indoor measurements, you can calculate the attenuation caused by building materials like radiant barrier insulation or reinforced concrete. If you find a strong signal at the roofline but none indoors, the issue is building interference rather than a lack of carrier coverage.
Documenting Your Findings
Consistency is vital when you're learning how to measure mobile signal strength for hardware planning. Atmospheric conditions and network congestion can cause readings to fluctuate, so it's best to conduct your audit during both peak and off-peak hours. Creating a simple signal map of your property will help identify specific dead zones and the most effective placement for internal MIMO antennas. It is essential to record the specific Band Number, such as Band 3 or Band 28, for every individual reading to ensure frequency consistency across your data set.
If your site audit reveals a significant discrepancy between outdoor and indoor signal levels, we recommend consulting with an expert for a detailed RF site assessment to determine the most effective hardware solution.
From Data to Deployment: Choosing Hardware Based on Your Measurements
Once you've quantified your RF environment, the transition from raw data to a mechanical solution is a matter of engineering logic. If your audit on how to measure mobile signal strength revealed an outdoor RSRP below -110 dBm, your primary challenge is path loss. In these fringe environments, a standard omnidirectional antenna will fail to capture enough energy for a stable handshake. You require high-gain directional hardware that can focus its reception pattern toward the specific tower bearing you identified during your site audit. Accuracy requires precision.
Preserving every decibel of your measured signal is critical for success. Using inferior RG-58 cabling can result in high attenuation, effectively nullifying the gains of a high-end antenna before the signal reaches your device. This is why LMR-400 coaxial cable is non-negotiable for professional installations. Its low-loss properties ensure that the signal quality reaching your booster or modem remains as close as possible to the raw measurements recorded at the roofline.
Matching Hardware to dBm Readings
Your hardware selection should be dictated by the specific metrics you've recorded. For locations where outdoor signal is fair (-90 to -105 dBm) but building materials cause significant penetration loss, a Cel-Fi GO is the most effective tool to relay and amplify that signal indoors. However, if your RSRP is strong but your SINR is low, the problem is interference rather than power. In these high-noise environments, deploying MIMO antennas with cross-polarised elements allows your hardware to distinguish between the carrier signal and background noise, significantly improving data throughput.
The Legal Landscape for Australian Boosters
The Australian legal landscape is strict regarding the use of signal repeaters. Many cheap, unapproved consumer boosters found online lack the sophisticated network protection features required by local carriers. These devices often oscillate and cause severe interference, which can lead to the ACMA issuing significant fines. The Cel-Fi GO is currently the only legal, carrier-approved solution for Australian consumers because it is designed to shut down automatically if it detects network interference. If your site measurements indicate that height is the only way to achieve a stable link, you may need a more robust infrastructure approach involving communication tower design to clear local obstructions.
Understanding how to measure mobile signal strength is the first step in a successful installation, but interpreting that data requires technical experience. If your findings are inconsistent or you're unsure which MIMO configuration suits your specific RSRP profile, you should contact Telco Antennas for a professional interpretation of your signal data to ensure your hardware investment delivers the intended performance.
Optimising Your Connectivity with Clinical Precision
Transitioning from arbitrary signal bars to objective dBm metrics allows you to identify the mechanical root of your reception issues. By accurately quantifying RSRP and SINR, you move beyond guesswork and gain the technical clarity required to address building penetration loss or environmental interference. Understanding how to measure mobile signal strength is the essential first step in designing a cellular solution that performs reliably under real-world conditions.
Reliable connectivity in the 2026 Australian landscape requires a combination of precise data and professional-grade hardware. As an Australian owned and operated specialist since 2008, Telco Antennas provides the expert RF engineering support needed to interpret complex site audits. Whether you require authorised Cel-Fi specialists or high-gain MIMO configurations, we ensure your deployment is based on clinical accuracy rather than marketing icons. Audit your site with professional RF hardware from Telco Antennas today to stabilise your link. With the right metrics and engineering-led support, you can achieve consistent, high-speed performance across any Australian property.
Frequently Asked Questions
Is -100 dBm a good mobile signal strength in Australia?
A reading of -100 dBm is considered fair to poor depending on the network type. For 4G, it's often the threshold where indoor coverage becomes unreliable. For 5G, it's near the lower limit for high-speed data. While it's better than the ACMA's -115 dBm "no coverage" floor, it lacks the headroom needed for stable performance. If your readings sit here, you'll likely experience slower data speeds and occasional dropouts.
How do I check signal strength in dBm on my iPhone?
You can check this by dialling *3001#12345#* in the phone app to enter Field Test Mode. Once inside, navigate to the "Cell Info" or "Serving Cell" menu to find the RSRP value. This menu provides the raw engineering data required for anyone learning how to measure mobile signal strength with precision. Note that the menu layout changes slightly between iOS versions, but RSRP remains the standard metric for performance.
Why does my signal strength change when I hold my phone differently?
This occurs because of "body loss," where your hand or head physically obstructs the internal antennas. Modern smartphones use multiple antennas to mitigate this, but a firm grip can still attenuate the signal by several decibels. When conducting a site audit, it's best to hold the phone by the edges or place it on a flat surface. This ensures that your body isn't artificially lowering the RSRP readings you record during the test.
Can a mobile signal booster improve my SINR (signal quality)?
A booster primarily improves signal strength, though a high-quality unit like a Cel-Fi GO can indirectly stabilise SINR by providing a cleaner handshake with the tower. However, if the source signal at your donor antenna is already noisy, the booster will simply amplify that noise. To improve SINR, you often need a high-gain directional MIMO antenna to isolate the carrier signal from background interference before it reaches the booster unit.
What is the difference between 4G and 5G signal measurement?
While both use RSRP and SINR, 5G requires higher quality thresholds to maintain the complex MIMO streams needed for gigabit speeds. 4G measurements are often more stable over longer distances. In contrast, 5G standalone (SA) metrics in 2026 are more sensitive to physical obstructions. When investigating how to measure mobile signal strength, ensure you're looking at the "NR" (New Radio) metrics for 5G rather than the legacy LTE values for 4G networks.
Do trees and rain actually affect my mobile signal readings?
Yes, environmental factors significantly impact radio frequency propagation. Dense foliage contains moisture that absorbs and scatters high-frequency signals, particularly on 5G bands. Heavy rain can cause "rain fade," where water droplets attenuate the signal between the tower and your device. If you're conducting a site audit, it's vital to note the weather conditions, as a signal that works in dry weather might fail during a heavy summer storm.
Is there a free app that shows the nearest Telstra tower?
There isn't a single perfect app, but resources like Oztowers or the ACMA's official database are the most reliable for finding Australian tower locations. While some free apps attempt to map towers, they often use crowdsourced data that can be inaccurate or outdated. For professional results, cross-reference these databases with your own directional signal measurements to confirm which specific tower your device is actually communicating with during a site test.
Why do I have full bars but the internet is not working?
This is usually caused by high interference or tower congestion rather than a lack of signal strength. Your phone shows "full bars" based on RSRP, but if the SINR is low or the tower is over capacity, data cannot flow effectively. This is the "Ghost Signal" phenomenon where raw power is only half the connectivity puzzle. Signal quality is the metric that actually dictates your internet speed and connection stability.


