

Why does your cellular router display four bars of signal while your critical video conference continues to buffer and drop out? It is a persistent frustration for professionals who rely on remote connectivity, but understanding RSRP RSRQ SINR is the only way to move beyond these deceptive icons. You have likely realised that those simplified bars are often more about user reassurance than technical reality, leaving you confused when faced with the dense data tables found in a professional router interface.
Mastering these specific metrics allows you to look past marketing graphics and diagnose exactly what is occurring at the radio frequency level. By interpreting this data correctly, you can accurately predict your actual data throughput and identify whether your connection issues stem from signal power, environmental interference, or network congestion. This knowledge is essential for anyone tasked with maintaining high-performance 4G or 5G links in challenging environments.
In this guide, we provide a clinical breakdown of what these values represent and offer the benchmarks needed to evaluate your own connection. We also outline the mechanical solutions, from high-gain MIMO antennas to low-loss LMR-400 coaxial cabling, that can optimise your connection and move your metrics from poor to excellent.
Key Takeaways
- Recognise why standard signal bars are often deceptive and why raw power (RSSI) is a poor indicator of actual data performance.
- Develop a technical advantage by understanding RSRP RSRQ SINR to accurately diagnose connection stability and throughput issues.
- Learn the practical steps to access hidden field test modes on mobile devices and professional router interfaces for precise data collection.
- Identify how mechanical solutions, including MIMO antennas and low-loss LMR-400 coaxial cables, physically improve your signal quality.
- Establish clear benchmarks to compare your current metrics against industry standards for reliable 4G and 5G connectivity.
Beyond the Bars: Why RSSI and Signal Bars are Deceptive
Most mobile devices use a simplified graphical representation of signal strength, but these bars are often a poor metric for actual performance. They typically rely on the Received Signal Strength Indicator (RSSI), a measurement that tracks the total power received across the entire frequency band. Because RSSI is a wideband metric, it includes not just the useful signal from your carrier, but also background noise and interference from neighbouring towers. Consequently, a device might show "full bars" simply because the environment is loud, not because the connection is clear. Understanding RSRP RSRQ SINR is critical because these metrics separate the useful signal from the ambient electronic noise. RSRP and RSRQ were specifically developed within the LTE standard to provide a more accurate assessment of signal strength and quality by measuring specific reference signals rather than the entire noisy bandwidth.
The Problem with Wideband Power Measurements
In the era of 3G, we relied on Received Signal Code Power (RSCP), but as networks evolved toward 4G and 5G, the complexity of radio environments increased. RSSI is indiscriminate; it factors in thermal noise, interference from other electronic devices, and signals from distant towers on the same frequency. If you are in a crowded Australian suburb, your router might report a high RSSI because it is picking up "noise" from hundreds of other devices. This creates a "dirty signal" where the raw power is high, but the signal-to-noise ratio is too poor for the modem to decode data packets effectively. To address this, the 3GPP standards introduced more granular metrics like Reference Signal Received Power (RSRP) and RSRQ, which specifically measure the reference signals rather than the entire bandwidth.
Real-World Symptom: The "Full Bars" Data Stall
We have all experienced the "data stall" where a phone shows a strong connection but fails to load a single webpage. This usually happens when the signal quality is degraded even if the power is sufficient. While raw signal bars might suggest a perfect link, professional RF engineering ignores these icons in favour of decibel-based metrics. High power with poor quality often indicates high RSRQ (interference) or low SINR (noise), which causes the modem to constantly request retransmissions of lost data packets. Tower congestion can also play a part, but more often than not, the hardware is simply struggling to hear the tower over the surrounding "chatter." Moving to professional hardware allows you to bypass these deceptive visual aids and view the raw data required to troubleshoot a failing link.
The Big Three: Decoding RSRP, RSRQ, and SINR
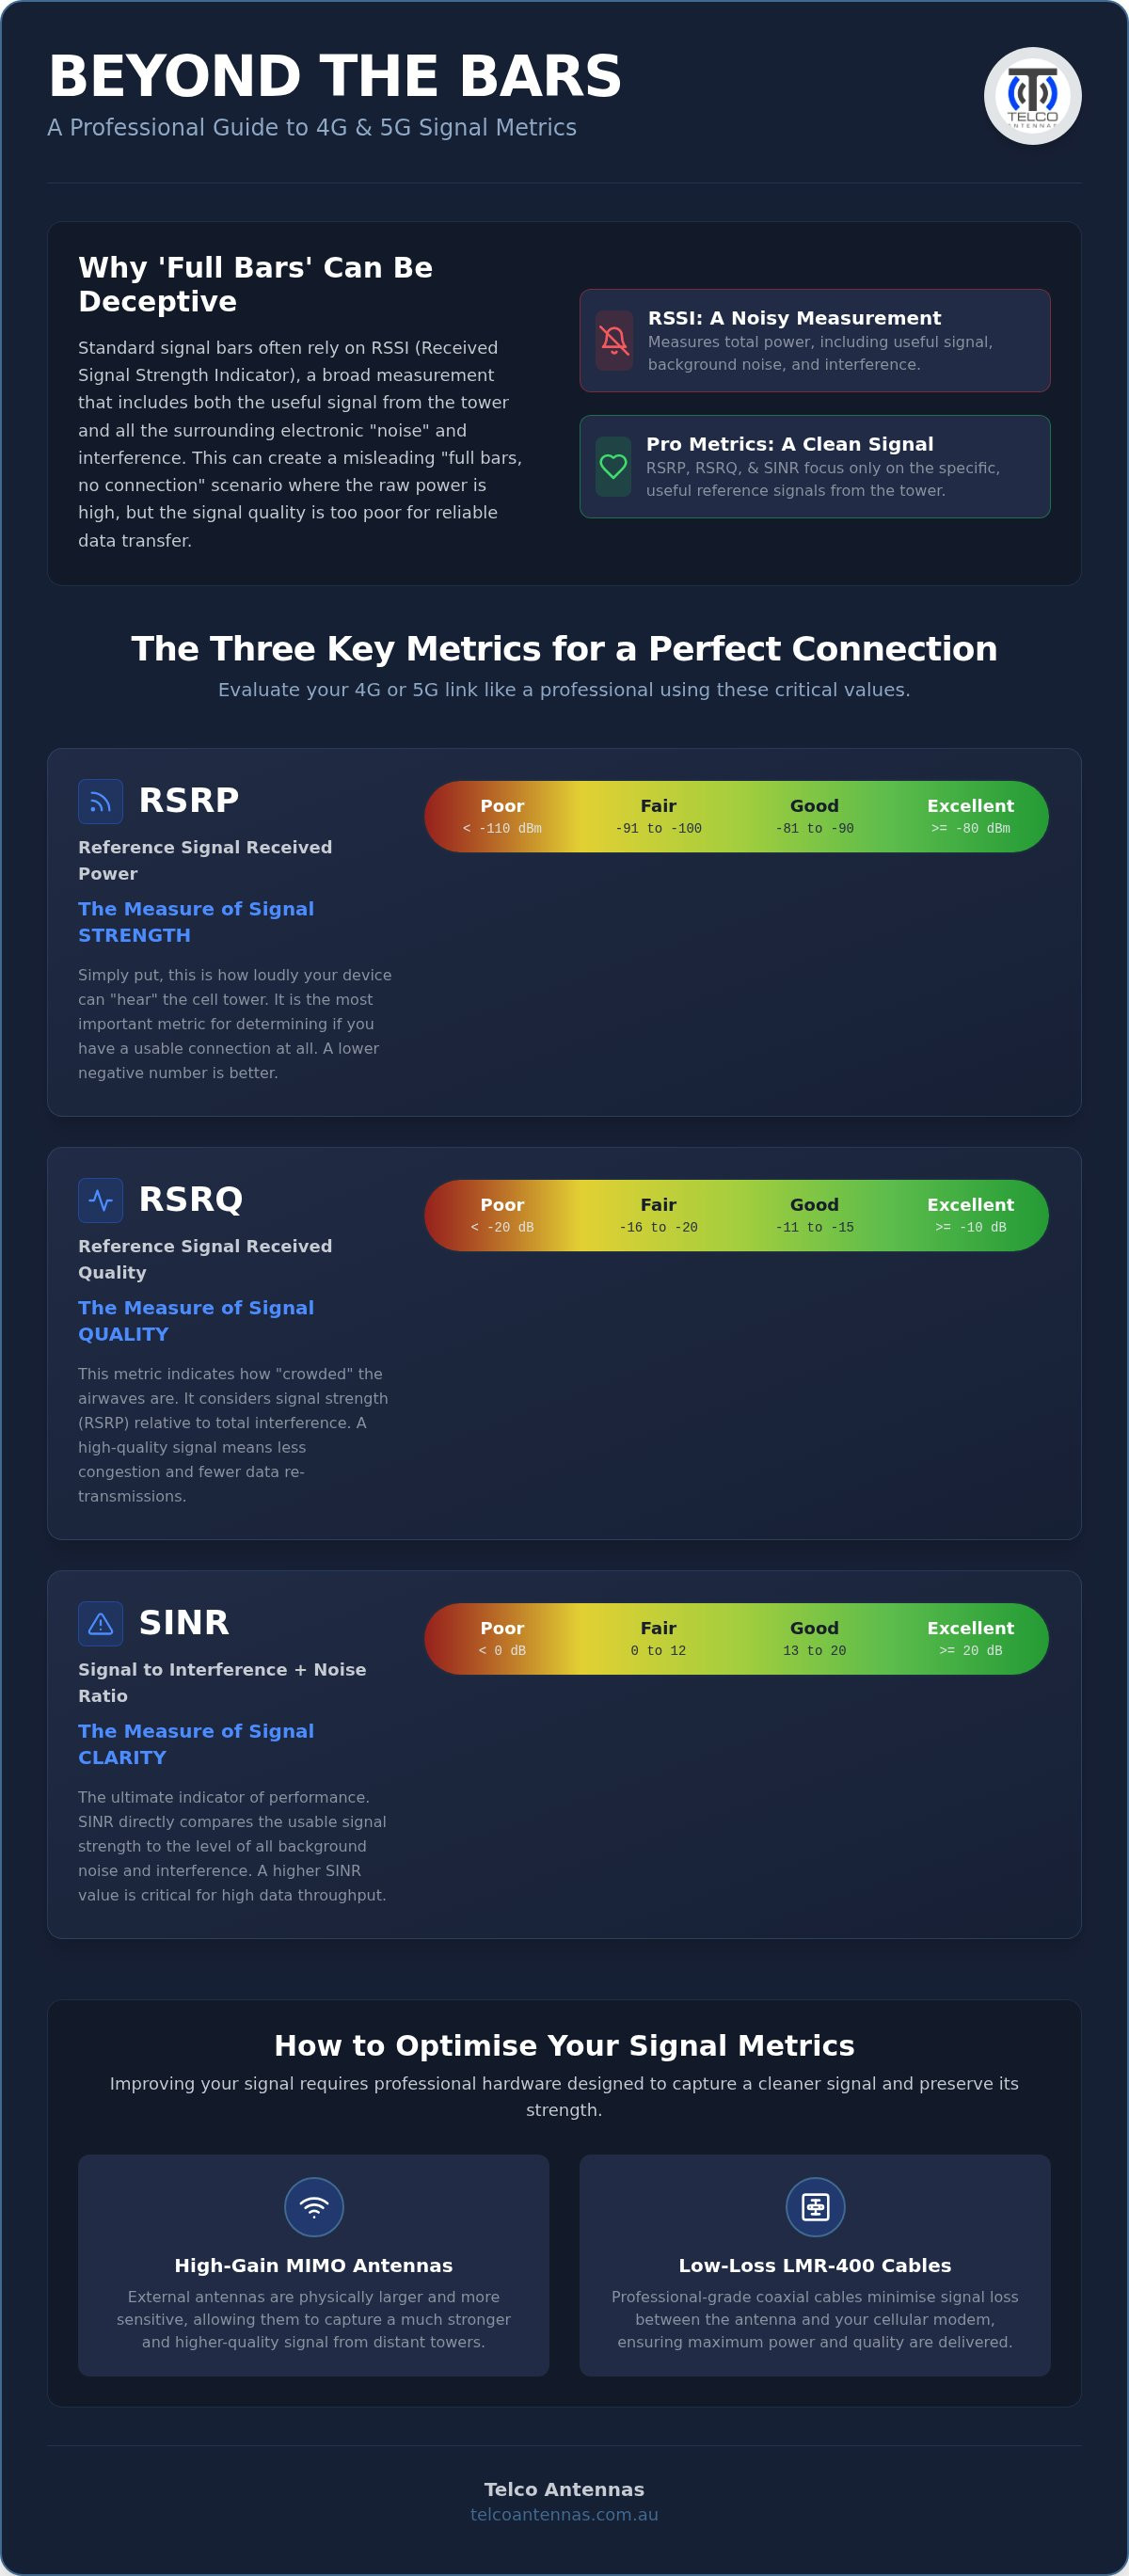
To move beyond the guesswork of signal bars, we must examine the specific measurements defined by 3GPP standards. Understanding RSRP RSRQ SINR requires a shift in perspective from general power to specific radio frequency performance. These three metrics work in tandem to describe the strength, quality, and clarity of your connection. While RSRP tells you if you can hear the tower, RSRQ and SINR tell you if you can actually understand the data it is sending. Use the following table as a professional benchmark for evaluating your current 4G or 5G connection levels.
| Metric | Excellent | Good | Fair | Poor / Unusable |
|---|---|---|---|---|
| RSRP (dBm) | >= -80 | -81 to -90 | -91 to -100 | < -110 |
| RSRQ (dB) | >= -10 | -11 to -15 | -16 to -20 | < -20 |
| SINR (dB) | >= 20 | 13 to 20 | 0 to 12 | < 0 |
RSRP: The Narrowband Power Metric
Reference Signal Received Power (RSRP) is the most direct measurement of signal strength. Unlike the wideband RSSI discussed previously, RSRP is a narrowband measurement that only tracks the power of the specific reference signals transmitted by the tower. This is why RSRP is always a negative number measured in decibel-milliwatts (dBm). A reading of -70dBm represents an excellent, strong connection, whereas -110dBm indicates you are at the absolute edge of coverage. Your distance from the Telstra or Optus tower is the primary factor here, but physical obstructions like hills or concrete walls also drive this value down. In 5G networks, this metric becomes more complex due to beamforming, where the Synchronization Signal Block (SSB) might show different power levels than the data channels themselves.
RSRQ and SINR: Measuring the Clarity
Clarity is often more important than raw power for high-speed data. Reference Signal Received Quality (RSRQ) indicates the ratio of the useful signal to the total interference. It is a critical metric for mobile applications because it helps the device decide when to handover between towers. If RSRQ is poor, your device will struggle to maintain a stable link. Signal-to-Interference-plus-Noise Ratio (SINR) is the ultimate predictor of throughput. It measures the "cleanliness" of the signal by comparing the desired signal to the background noise and interference. A high SINR (above 20dB) allows the network to use advanced modulation schemes like 256QAM, resulting in significantly faster download speeds. Conversely, terrain reflections and internal building noise from unshielded electronics can degrade SINR, causing packet loss even if your RSRP is strong. If your metrics fall into the "Poor" category despite being near a tower, a professional RF site survey can identify the specific environmental factors causing the degradation.
How Signal Metrics Impact Your Data Throughput
While the previous sections defined these values, the practical application lies in how they dictate your data speeds and connection reliability. Understanding RSRP RSRQ SINR is the foundation for troubleshooting why a connection with high power might still feel sluggish. There is a direct, linear relationship between these radio frequency metrics and the data throughput your modem can achieve, primarily governed by the signal's cleanliness. For professionals managing remote sites or critical failover systems, these metrics are the difference between a seamless operation and a failed connection.
Modulation and Coding Schemes (MCS)
Modulation and Coding Schemes (MCS) are the instructions the tower uses to determine how much data to pack into each radio wave. When your SINR is high, typically above 20dB, the network can utilise 256QAM (Quadrature Amplitude Modulation). This allows the tower to talk faster to your device by encoding more bits into every symbol transmitted. If SINR drops due to environmental interference or electronic noise, the system must fallback to simpler, less efficient modulation schemes like 64QAM or 16QAM to ensure the data remains readable. This fallback directly slashes your maximum download speeds, as the "density" of the data being transmitted is reduced to maintain a stable link. High SINR is essentially the gatekeeper for the ultra-high speeds promised by 5G networks.
Latency, Jitter, and Connection Stability
Raw speed is only one part of the equation; stability is often more critical for professional applications like VoIP, video conferencing, and gaming. Fluctuating RSRQ values are the primary cause of jitter and latency spikes. When the quality of the reference signal is inconsistent, the modem must frequently request packet retransmissions. Each retransmission adds milliseconds of delay, leading to the "lag" that disrupts real-time operations. This impact is particularly noticeable in 4G/5G failover systems where a clear signal is required to provide a comparable user experience to primary fibre links. To address these throughput bottlenecks, implementing MIMO Antennas: A Technical Guide provides the mechanical path to improving both signal quality and spatial diversity, which stabilises these metrics.
When RSRP drops below -120dBm, you have reached what engineers call the "cell edge." At this level, the signal is so faint that the modem struggles to maintain a handshake with the tower. Even if the environment is quiet, the sheer lack of power means the connection will be prone to dropping out entirely during heavy rain or when foliage is wet. For critical work, maintaining stable metrics is far more important than occasionally hitting high peak speeds, as a consistent "Good" reading provides a better user experience than a "Fair" signal that frequently dips into the unusable range.
Professional Troubleshooting: How to Measure Your Metrics
Transitioning from theoretical basics to practical application requires the right tools to view raw data. Relying on the visual bars of your device is insufficient for a technical installation. To achieve a reliable link, you must access the engineering menus of your hardware to view real-time decibel readings. This process is essential for anyone understanding RSRP RSRQ SINR in a real-world context, as it allows for precise adjustments to antenna positioning and hardware configuration. Always remember that measurements taken inside a building are often 10dB to 20dB lower than those taken at the roofline due to penetration loss. Therefore, your primary testing should occur at the intended antenna mounting point to ensure your baseline data is accurate.
Accessing Field Test Mode on Your Mobile
Your smartphone contains a hidden diagnostic interface designed for technicians. On an iPhone, you can access this by opening the Phone app and dialling *3001#12345#* followed by the call button. This launches the Dashboard; look for the "Serving Cell Info" or "RsrpRsrqSinr" tabs to see the live metrics. For Android users, the menu is often found under "About Phone" and then "Status," though some models require third-party applications to expose these specific parameters. These interfaces provide a granular look at how your device interacts with the tower, updating every few seconds as environmental conditions shift. Watching these real-time updates while moving around your property is the most effective way to identify local signal shadows and interference zones.
Mapping Your Local RF Environment
A "Walk Test" involves taking several readings across your site to find the point of highest signal quality. It isn't just about finding the highest RSRP. You are looking for the location with the highest SINR, which often means moving away from metal sheds or power lines that cause electronic interference. Use available Telstra tower location data to identify the bearing of your nearest base station. Aligning a directional antenna based on this bearing, then fine-tuning it while observing your router's web interface, ensures you are capturing the cleanest possible signal. Documenting these metrics before and after hardware changes is the only way to verify the performance gains of your installation. If your readings remain inconsistent despite these efforts, it may be time to book a professional RF site survey to identify complex interference patterns that consumer devices cannot detect.
Optimising Your Metrics with Professional Hardware
Identifying poor readings is only the first step; the objective is to deploy hardware that physically alters the radio environment in your favour. Understanding RSRP RSRQ SINR provides the diagnostic data needed to select the correct equipment for your specific location. While a software update cannot fix a physical signal shadow, high-gain antennas and signal boosters can overcome environmental limitations. By matching the hardware to the metric that is failing, you can move a connection from unstable to carrier-grade reliability.
One of the most effective ways to address poor quality is through the use of Cel-Fi GO signal boosters. These devices are engineered to "clean up" RSRQ by isolating the carrier signal and re-broadcasting it with significantly less noise. In areas where the signal is present but unreadable due to interference, a booster acts as a precision filter. Similarly, MIMO (Multiple Input Multiple Output) antennas improve SINR by using spatial diversity to distinguish between the intended data stream and reflected multipath interference. This mechanical advantage allows the modem to maintain higher modulation schemes even in challenging RF environments.
Antenna Selection for Specific Metric Fixes
The choice of antenna should be dictated by your weakest metric. If your RSRP is lower than -110dBm in a remote black spot, a high-gain directional Yagi antenna is required to "reach out" to the distant tower. Conversely, in urban areas where power is high but SINR is low, a MIMO array is superior. MIMO antennas use multiple elements to capture different phases of the same signal, which effectively increases the "clarity" for the modem. For temporary sites or rapid response requirements, deploying these antennas on Portable Communication Towers ensures you can clear local obstructions like treelines or buildings that degrade RSRQ.
The Importance of Low-Loss Cabling
It is a common mistake to invest in high-end antennas only to lose the gained signal in poor-quality cabling. Standard RG58 cable is often unsuitable for long runs in 4G and 5G installations because it exhibits high attenuation, especially at higher frequencies like 3500MHz. By switching to LMR-400 coaxial cable, you significantly reduce dB loss per metre. For instance, a 10-metre run of RG58 might lose 5dB to 8dB of signal, effectively negating the gain provided by your external antenna. LMR-400 preserves that power, ensuring the RSRP measured at the antenna actually reaches the modem. If you find that your metrics remain poor despite high-quality hardware, a comprehensive RF site survey is the final step to identify hidden environmental variables that require advanced engineering solutions.
Achieving Carrier-Grade Connectivity
Moving past the simplified graphics of mobile signal bars is the first step toward a stable, high-performance connection. You've now gained the technical foundation for understanding RSRP RSRQ SINR, which lets you diagnose whether your throughput issues are caused by raw power deficits or environmental interference. By measuring these metrics at the antenna mounting point and comparing them against professional benchmarks, you can identify the exact hardware required to move your link from poor to excellent.
We're Australian RF engineering specialists providing the high-end equipment and expert site survey services needed to solve complex connectivity challenges. Whether you require low-loss LMR-400 coaxial cables to preserve signal strength or directional MIMO arrays to improve clarity, our team offers national delivery and technical support to ensure your installation succeeds. View our range of Professional MIMO Antennas and Signal Boosters to start optimising your network today. With the right data and professional-grade hardware, you can finally achieve the reliable 4G or 5G performance your operations demand.
Frequently Asked Questions
What is a "good" RSRP value for 4G LTE in Australia?
An excellent RSRP value for Australian 4G LTE networks is -80 dBm or higher. A reading between -81 dBm and -90 dBm is considered good for most professional applications. Once you drop below -110 dBm, you are at the edge of coverage where the connection becomes unstable. Maintaining a strong RSRP is the first step in understanding RSRP RSRQ SINR and ensuring your modem has sufficient power to stay connected to the tower.
Can I have a high RSRP but a low SINR?
It is common to see a high RSRP alongside a low SINR, particularly in urban environments with significant electronic noise. While RSRP indicates the raw power of the reference signal, SINR measures how clean that signal is compared to background interference. High power alone is insufficient if the signal is "dirty." This scenario often results in slow data speeds despite having full signal bars, as the modem struggles to decode the noisy transmission.
How does SINR affect my actual download speed?
SINR directly dictates the Modulation and Coding Scheme (MCS) your device uses. A high SINR, ideally above 20 dB, allows the network to use 256QAM, which packs more data into each radio symbol. If your SINR is low, the network must drop to a simpler modulation like 64QAM or 16QAM to maintain the link. This fallback significantly reduces your maximum download capacity, as the density of the data transmission is lowered to prevent errors.
Why does my RSRQ change when I move my router only a few centimetres?
Radio frequency signals at 4G and 5G frequencies are highly susceptible to multipath interference. Moving a router just a few centimetres can change how the signal reflects off metal frames, concrete walls, or glass. These reflections can either cancel out or reinforce the primary signal. Small adjustments in position can significantly shift your RSRQ as the modem finds a sweet spot where the ratio of useful signal to interference is more favourable.
What is the difference between RSRP and RSSI?
RSSI is a wideband measurement that represents the total power received across the entire frequency band, including noise and interference from other towers. RSRP is a narrowband measurement that only looks at the power of the specific reference signals from your serving cell. RSRP is the more accurate metric for determining coverage because it ignores the background chatter that often inflates RSSI readings and gives a false sense of signal strength.
Is SINR the same as SNR?
Signal-to-Noise Ratio (SNR) typically measures the desired signal against background thermal noise. SINR is a more comprehensive metric used in cellular networks because it also accounts for interference (I) from neighbouring towers on the same frequency. In a crowded Australian radio environment, interference is often a bigger problem than thermal noise. Therefore, SINR provides a more realistic view of the signal quality your modem has to work with in the real world.
How do I improve my RSRQ in a high-density area?
Improving RSRQ in high-density areas requires isolating your device from interfering signals. High-gain directional MIMO antennas are the most effective mechanical solution for this. By pointing a directional antenna directly at your serving tower, you can physically block out signals from other directions that contribute to interference. This spatial filtering cleans up the signal quality, allowing the modem to maintain a more stable handshake with the network even in noisy environments.
Does 5G use the same RSRP and RSRQ metrics as 4G?
5G NR (New Radio) uses the same basic metrics, but the measurement methodology has evolved. In 4G, metrics are based on Cell-specific Reference Signals (CRS). In 5G, they are based on the Synchronization Signal (SS) and Channel State Information (CSI). While the values remain similar, 5G metrics like SS-RSRP are measured within the Synchronization Signal Block (SSB). Understanding RSRP RSRQ SINR across both generations is vital for troubleshooting modern dual-connectivity hardware.


